After you’ve identified and compiled the list of use cases and its users, congratulations – you can now depict it visually.
Depicting it visually is going to be helpful for everyone involved in the project. It will help guide analysts and programmers, alike as they further develop the program. This can be depicted in a use case diagram
Notation of a Use Case Diagram
There are 4 parts in creating a use case diagram:
- Stickman figure: This represents the actor or the person using the system
- Connecting Line: This connects the user and its respective use cases
- Automation Boundary: This is the box that separates the computer and the people operating the system
- <<includes>> relationship: It is the required sub-task (another use case) that always happen. Think of it like an immediate consequence.
What is a use case diagram?
A Use Case Diagram is one of the UML models that depicts use cases and its appropriate users.
Here is a use-case diagram that I’ve made for an online banking system:
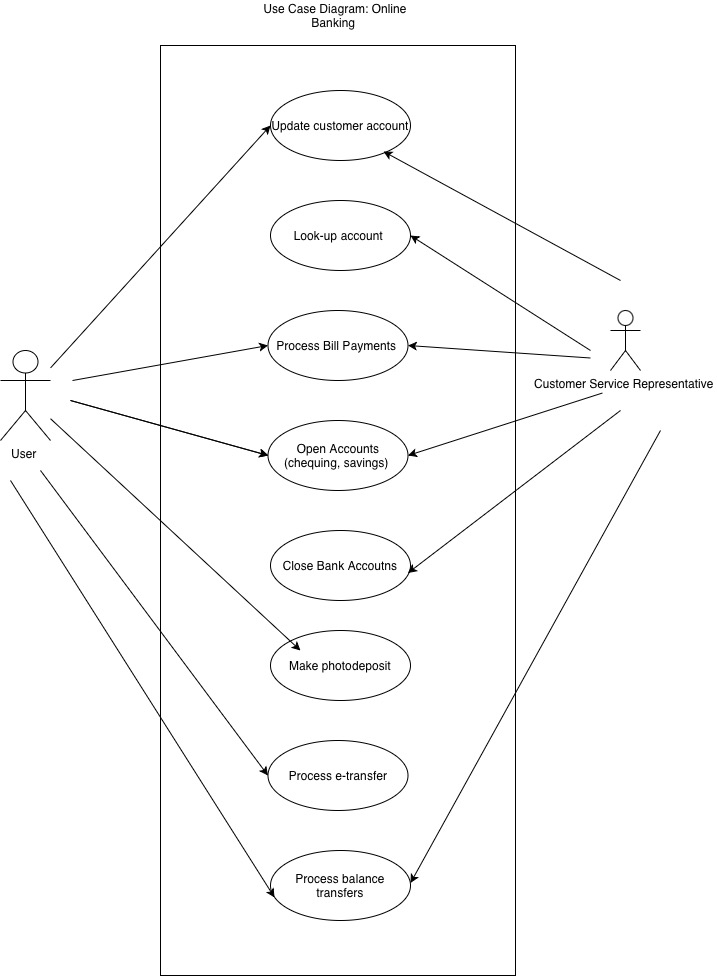
In the middle, it depicts the different use cases. I’ve listed the two actors (for simplicity) that are involved. As you can see, the user and customer service representative have some functionalities that they can’t do.
I’ve talked about the <<include>> relationship, here is an example of what I’ve done to showcase relationships
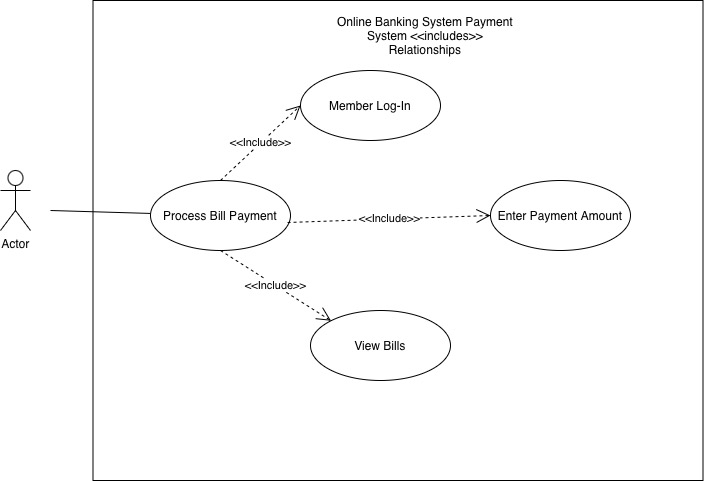
Here, the process bill payment use case shows that it includes 3 other use cases: Member Log-In, Enter Payment Amount, and View Bills. What it does it prevents redundancy and makes the visual look cleaner.

Leave a comment